Data-driven visual content on global trends, investing, technology, & more.
Which states now have more deaths than births? Explore America's growing demographic divide and where population growth depends on migration.
Discover which countries minted the most new millionaires in 2025, led by the U.S.
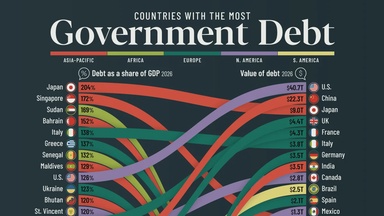
The U.S. has a larger government debt than any other country worldwide. Relative to its GDP, though, the country barely makes top ten.
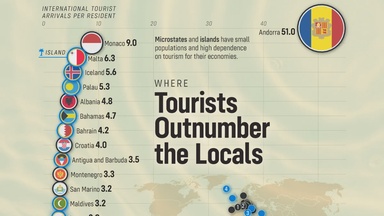
Across the world, some smaller countries have become so popular to visit that tourists even outnumber residents.
The top five beer producers by volume brew more than half of the world's beer, with European brewers featuring the most prominently among the top 40 global brewers.
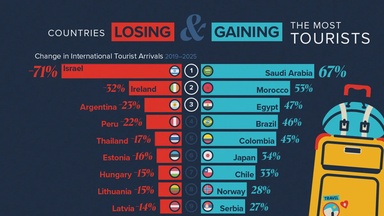
Explore which countries have gained and lost the most tourists since 2019, with Saudi Arabia posting the biggest increase and Israel the steepest decline.
Adidas, Nike, or Puma? Explore which brands supply every team competing at the expanded 2026 FIFA World Cup.
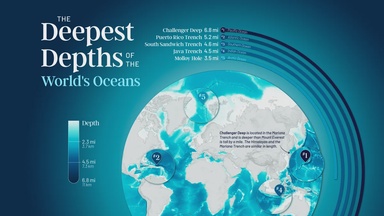
Challenger Deep in Pacific Ocean's Mariana Trench is the deepest depth in the world's oceans, with the Puerto Rico Trench in the Atlantic Ocean ranking second among the five oceans' deepest points.